One of the challenging problems in the literature is to map out the stability/instability composition of the following control system in the parameter space of the delays

----------------------

Stability charts are the display of the stability mapping depicted with respect to delays. Among many of his other contributions, we wish to cite Gabor Stepan's work in this line of research.


Examples

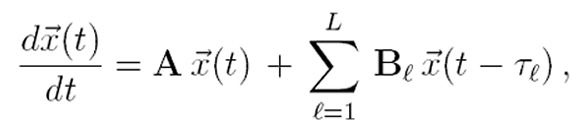
  1. A single delay example L = 1

    This problem goes back to 1960s, and many milestones were covered in this problem.

    Since there is only one delay, the stability chart is displayed along the 1-dimensional positive delay axis, where this axis is divided into infinitely many intervals. Any delay value in an interval either makes the TDS stable or unstable. Consequently, one can label the intervals as "stability favoring" or "instability favoring". The stability favoring intervals are also called as "stability intervals" or "stability pockets".

    In the TDS presented, when L = 1, A = -2, B = -5, we find the following stability interval: 0 < = DELAY < 0.4326 sec., meaning that this dynamical system will be stable when the delay is less than 0.4326 sec, and it will be unstable when the delay is greater than or equal to 0.4326 sec.

    How could we compute the upper bound of the tolerable delay (so called "delay margin")? See our survey paper published in SIAM Control and Optimization in 2006.

  2. A two delay example L = 2

    When there are two delays, the stability charts become 2-dimensional on the plane of two positive delays. Analogous to stability intervals, one now finds the stability regions.

    See our articles in Automatica (2005) and IEEE Transactions on Automatic Control (2007).


  3. A three delay example L = 3, please see our article in Automatica 2009

  4. Can we find stability maps of systems with more than three delays? The answer is yes and no. Obviously it is impossible to visually display these maps in dimensions larger than three. Another challenge is that existing work has not so far did not touch this problem (except on few case specific problems). To avoid the visualization obstacle, we recently developed an accurate way of taking precise 2D/3D cross sections of these stability maps. This is the first of its kind in this direction, to our best knowledge. See our article in IEEE Transactions on Automatic Control in 2011.