|
An Agilent ADS Tutorial
May 12, 2009
Starting ADS
1. Start ADS by clicking "Advanced Design System Update 2" shortcut on the desktop or from the start menu.
2. ADS main window and the Getting Started with ADS windows open. From the Getting Started with ADS window you
can:
- by browsing to the location of the project
- Open an example project from the examples directory located in
C:\ADS2008U2\examples
Creating a project
1. Create a new project from the Getting Started with ADS window. You can also create a project from the Menu bar,
select File
→ New Project ..., when the dialogue appears, type any name you want
for the project. Click OK. (
spaces on file names or file paths are not allowed)
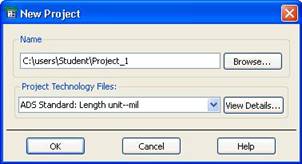
Figure 1: New Project Dialogue
2. The schematic window opens. This is where you build your designs. You have the option of using the Schematic
Wizard to help you setup a design.
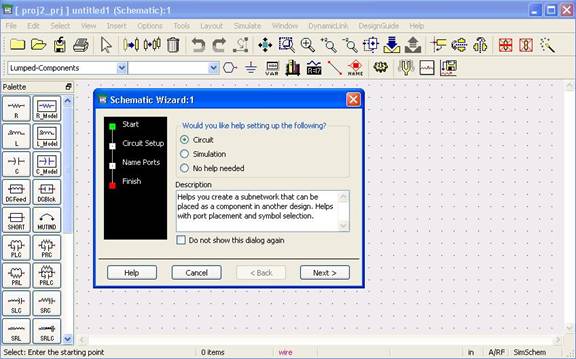
Figure 2: Schematic window with design setup wizard
You build your design using palettes. You can select different palettes from the scroll down
menu. Figure 2 shows a Lumped Components palette on the left with lumped elements.
Simulate a simple 2-port S-parameter network.
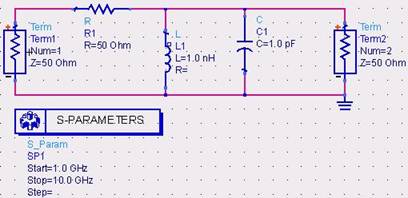
Figure 3: 2-port circuit network
1. Create a new project.
2. On the Schematic wizard, Check the 'No help needed' radio button. Click 'finish'. The wizard disappears.
3. On the Lumped components palette, click the component click the schematic window to paste it. Click escape to end
command and get the next component.
4. Open the S-parameter palette named "Simulation-S_Param".
5. Add two terminations for two-port network palette
 and the S-parameter comptroller palette. and the S-parameter comptroller palette.
 . .
6. Connect the components with the wire
 from the toolbar. from the toolbar.
7. To change the value of a component, double click on it and edit the values in the dialogue window.
8. Simulate design by clicking
 from the toolbar or selecting Simulate
→ simulate..., from the menu bar. from the toolbar or selecting Simulate
→ simulate..., from the menu bar.
9. Simulation status window and Results display windows open as shown in Figure 4
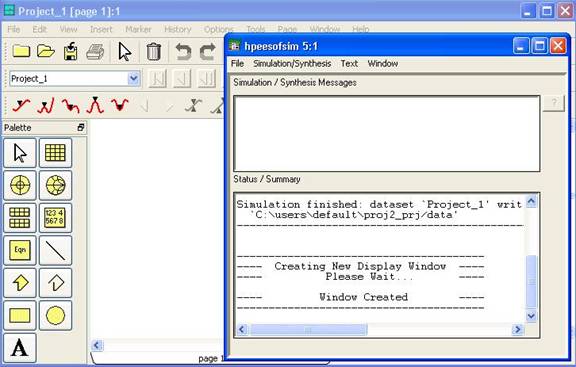
Figure 4: Results display and simulation status windows
Simulation results can be viewed in various forms
- Rectangular plot
- Polar plot
- Smith chart plot
- List of data
10. Click the appropriate icon for the plot type you want from the results palette
11. Click the open window to map the plot there
12. A "Plot Traces & Attributes" window open similar to Figure 5 opens
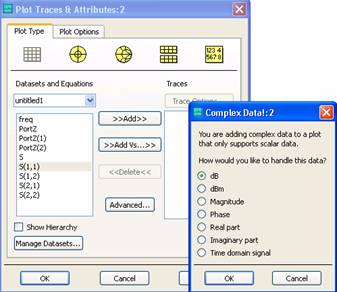
Figure 5:
P
lot Traces & Attributes window
13. Select data type under "Datasets and Equation".
14. Click Add to include the trace.
15. Select the data format for complex data if prompted to.
16. Click Ok.
Below is a sample of a smith chat plot of S
11 of the circuit in Figure 3.
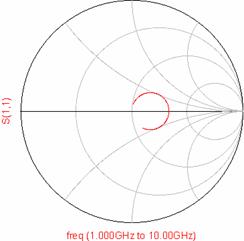
Figure 6: Smith plot S
11 scattering parameter results of a 2-port network
|