Modelling particle filtration in porous media
This learning module presents a model describing the collection of particles suspended in water onto porous media within a flow-through column. Students will use this model to illustrate how media properties, operating conditions, and particle properties influence the collection of particles, and how to design a filter to meet performance criteria.
Particulate matter present in water can be inorganic (like silica, clay, or metal oxides/hydroxides) or organic (organic matter) in nature and are typically between 0.1 and 100 microns in diameter (dp). Understanding how particles transport in porous media is important for situations such as pumping groundwater through sediments or treating water through engineered sand filters. The media is also termed collectors, and for sand filters, sand collectors are often sized at about 0.05 cm (Dc). Particles passing through porous media can collide with the media and attach to the media by a few different mechanisms:
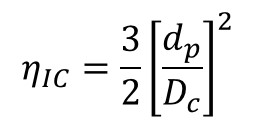
Interception: A particle collides with a collector when a flow streamline takes the particle there. The collector efficiency equation for interception is

Diffusion: A particle collides with a collector by Brownian movement. The collector efficiency equation for diffusion is

Where k is the Boltzman constant, T is absolute temperature, μ is water viscosity, and U is the superficial velocity.
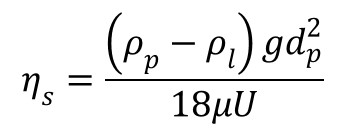
Sedimentation: A particle collides with a collector by settling. The collector efficiency equation for sedimentation is:

The total collector efficiency (ηc) is the sum of these three collector efficiencies. The total collector efficiency is an important parameter within the filter coefficient (λ):

Where Dc is the diameter of the collector media, α is the fraction of particles colliding with the collector that stick (assume α=1, or 100% attachment), and η is the media porosity. The filter coefficient is like a first order rate coefficient for the removal of particles from water along the distance of the flow path (that is, dC/dx = -λx). However, the filter coefficient changes over distance and over time due to particle collection on the media which decreases porosity. It is a non-constant value.
The objective of this exercise is to create a concentration versus media distance profile for particle removal from water flowing through a bed of collectors. Because λ changes with bed length and time, this profile must be calculated using a numerical approach instead of a simple analytical solution. The media bed, with a chosen length, is sliced into sections of specified lengths, and λis calculated for each section. As stated above, l depends on the media porosity. As particles accumulate on the collectors, porosity will decrease, and so a new porosity for each section is calculated as η= ηo-σ, where σ is the volume of collected particles per unit bed volume. The following equation is used to calculate σ:

Where σo is the σ value at time 0, U is the superficial velocity, Co is the initial concentration of suspended particles, ρp is the density of the particles, x is the media bed length, and t is the time passed. Because each section has its own η and σ values, each section needs to have its own λ value as well, and in the spreadsheet these three can be calculated in an iterative approach until λ values converge. Each section also has its concentration of suspended particles, C, calculated as C=Cin*exp(-λΔx), where Cin is the concentration of particles entering the section, λ is the filter coefficient for that section, and Δx is the length of that section.
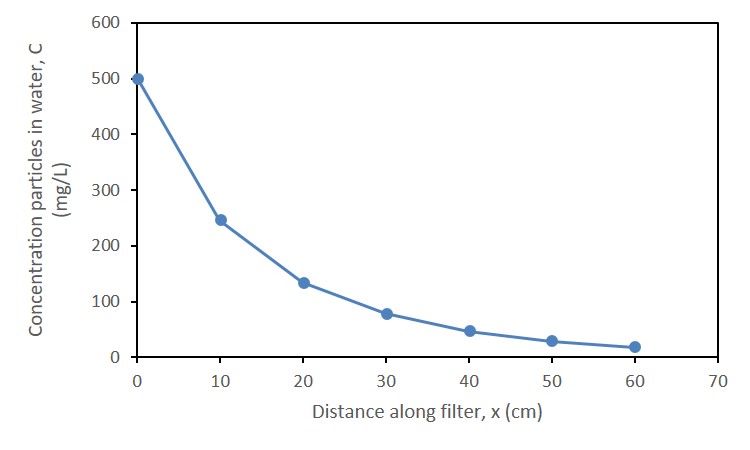
For any given water and media condition, after some chosen time, a particle concentration versus media bed distance can be plotted. Here is an example of such profile after 50 hours of operation:

The concentration of particles in water decreases in a manner similar to exponential decay along the bed length. After 50 hours, some particles are predicted to break through the end of the bed length. At this time, a filter would need to be cleaned by backwashing. Use the excel file to make simulations, decisions, and designs.
Simulation 1: A filter is filtering out suspended particles. Determine the influence of operation time on the suspended particle concentration profile in the filter bed. Use the parameters originally programmed in the spreadsheet. The original settings have a concentration versus filter distance profile already solved for an operation time of 50 hours, and in this situation the concentration of suspended particles decreases from 500 mg/L to 17 mg/L. 50 hours is about 2 days of operation. What would the effluent particle concentration be after 100 hours of operation?
Simulation 2: Determine the influence of particle diameter on filter performance. Use the original settings of the spreadsheet as a start. Create particle concentration profiles for particle diameters of 0.01, 1, and 100 microns. For which particle size does the filter perform best? For which particle size does the filter perform worst? Now, take this worst particle size, and try to see if a new filter media (larger sand size, instead of 0.05 cm use 0.2 cm Dc) will improve removal extent.
Design 1: A water with properties as originally programmed in the spreadsheet needs to be filtered. Only one sand filter is being designed, and you must find the bed length needed to meet the following performance criteria: the filter must have effluent particle concentration less than 5 mg/L after 100 hours of use, the filter column diameter is 5 m, and the flow rate must operate at 10,000 L/h. It may be necessary to add more lines of calculation to calculate additional sections of bed.
Design 2: A water with properties as originally programmed in the spreadsheet needs to be filtered. Now, water must be filtered at a flow rate of 15,000 L/h. The effluent concentration of particles must be less than 2 mg/L. The bed length is fixed at 1 m. What bed cross-sectional area is required to ensure this performance?
This learning module was supported by resources from the National Science Foundation.