Modelling water contaminant adsorption onto granular activated carbon in a treatment column
This learning module presents a model describing the removal of dissolved contaminants from water by adsorption onto media within a flow-through column. Students will use this model to illustrate how column properties influence reactor performance and how to design a column to meet performance criteria.
A column containing reactive media is envisioned to receive contaminated water that flows through the column and has its contaminants removed by adsorption onto the column media and, if applicable, reaction by chemical or biological means. Examples of such columns include:
Columns containing granular activated carbon (GAC) that adsorb organic contaminants or dissolved organic matter.
Ion exchange columns containing resin that adsorb dissolved cations or anions.
Columns containing media supporting microorganisms that together can adsorb and degrade contaminants.
Mixed-media columns, or soil and sediments in the ground, that contain solid media that can adsorb or chemically degrade contaminants.
Column reactors are assembled with the following properties:
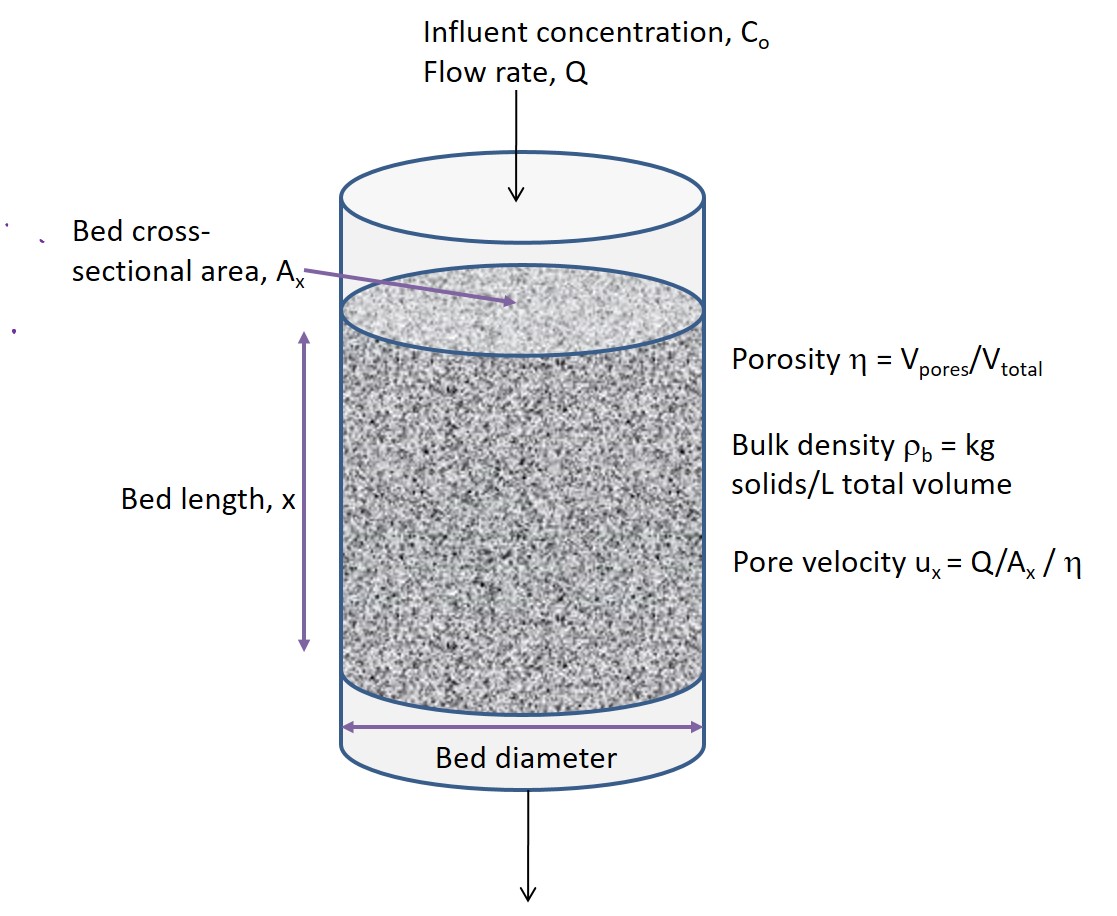
As water with a contaminant (e.g., red dye illustrated below) flows through the column, the contaminant will adsorb onto the media it first encounters, and clean water will flow out the column effluent. As more contaminants adsorb onto surface sites, the sites will eventually become exhausted, and no more adsorption will occur on this media, leaving unreacted solution to flow further through the column. Eventually the zone of saturated surface sites will grow along the column to the point where some contaminant will reach the column effluent. At this point, the column needs to be shut down and restored.
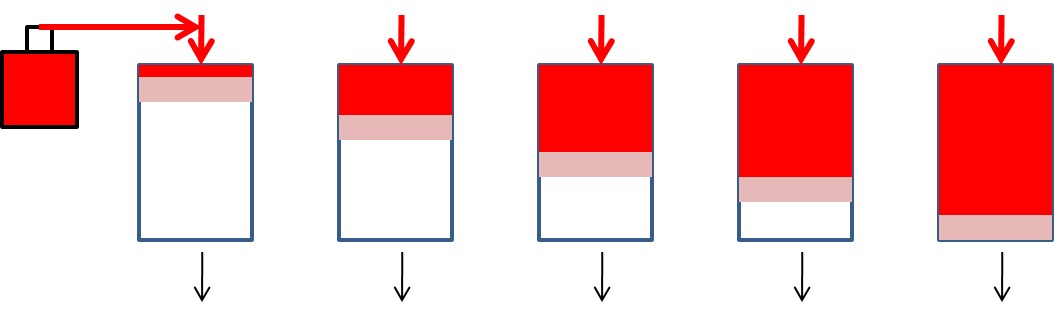
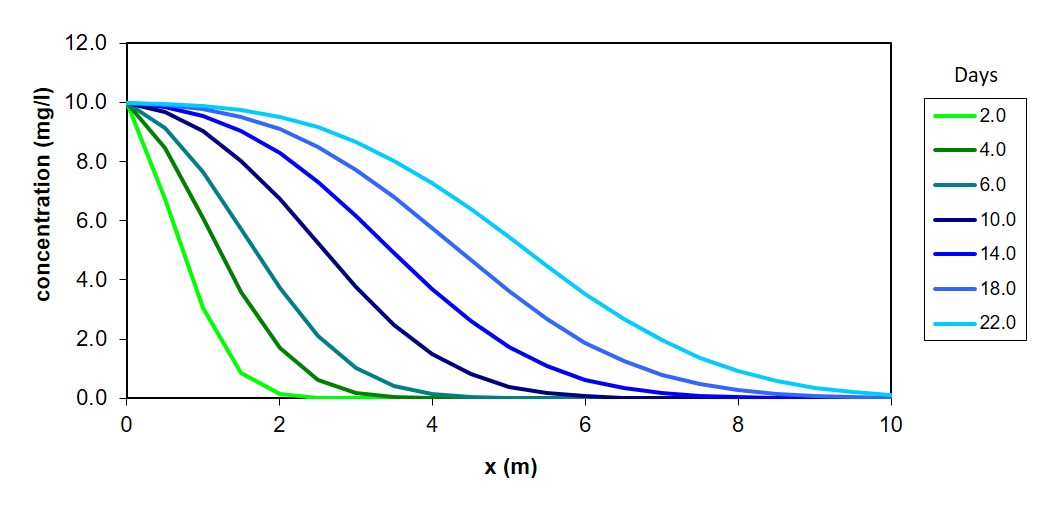
Accordingly, concentration profiles along the column length would resemble the following patterns. Dissolved contaminant concentration decreases over the length of the column so long as adsorption sites are available. Note after some time has passed, and the early column media is no longer adsorbing contaminants, the original contaminant concentration remains for some distance in the column. In this example, no reaction is occurring, only adsorption.
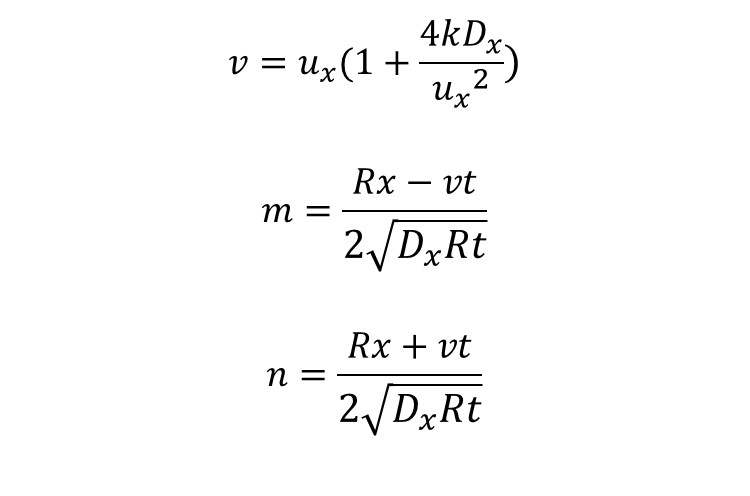
The mathematical model for contaminant behavior is based on the one-dimensional advection-dispersion-adsorption-reaction equation. The lecture notes on adsorption and column design should be consulted for the definitions of all terms. In brief:
Advection: The forward movement of contaminants with the water phase moving through the column. ux is the pore velocity.
Dispersion: The movement of contaminants due to dispersive action caused by porous media. Dx is the dispersion coefficient.
Adsorption: The attachment of contaminants from the water phase to the solid media phase. For simplicity, a linear model is assumed, that is, the concentration of contaminants on the adsorbed phase = adsorption coefficient Kd x concentration of contaminants in the aqueous phase. Moreover, the adsorption process can be described by the retardation coefficient, R = 1 + Kd ρb/η. R is the ratio of the velocity of the water to the velocity of the pollutant.
Reaction: The degradation of the contaminant due to a chemical or microbial reaction, separate from physical adsorption. For simplicity, a first-order decay model is assumed, that is, the reaction rate = k x concentration of contaminant in the aqueous phase.
The 1-D advection-dispersion-adsorption-reaction model is:
![]()
And its analytical solution is:
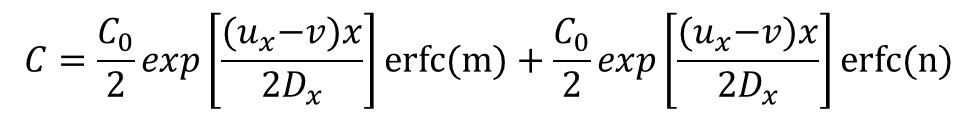
Where:
Plots of aqueous phase concentrations along the column length can be made using this analytical solution, such as in the example above. The media properties, column dimensions, and contaminant behavior parameters can be entered to calculate aqueous concentrations at any distance or time within the column. Use the following excel file to make simulations, decisions, and designs.
Simulation 1: Using the pre-set column properties with adsorption only (k=0), determine which contaminant behavior parameter most influences adsorption: adsorption Kd or dispersion Dx? First vary the value of Kd by a factor of 2 greater or 2 less than originally set. How does breakthrough (the time until some contaminant leaves the effluent) time change? Then, vary Dxby a factor of 2 greater or 2 less than originally set. Does breakthrough time change the same? Which parameter had the greatest effect?
Simulation 2: You are asked to simulate column performance at higher flow rates, specifically at a flow rate 4 times as high as original setting. First, with the original setting, determine the time until breakthrough as defined as effluent concentration being 10% of influent concentration. Vary the final “days” number until the concentration profile produces this effluent concentration. A faster flow rate will invariably cause breakthrough to occur earlier. Increase the flow rate by a factor of 4 to demonstrate this. Now, you have two options to try to adjust the column in order to have breakthrough occur at the same day as in the original setting: either making a column of longer then or making a column of wider diameter. Simulate, at the higher flow rate, what column length (but original column diameter) would be needed to have breakthrough occur at the desired time. Then, simulate what column length (but original column diameter) would be needed to have breakthrough occur at the desired time. Finally, which adjustment is preferable, that is, which adjustment results in the smallest volume of column material (you will need to calculate these using final bed lengths and diameters).
Simulation 3: Evaluate how the reaction term can help improve column performance. First, return to original settings, including the final time where breakthrough (10% of influent concentration) is in the effluent. Input a reaction rate coefficient (k) of 0.01 per min. Do aqueous concentrations along the column decrease noticeably? Repeat for k values of 0.1 and 1 per min and comment on how much concentrations decrease. Now, with a k value of 1 per min, how fast can flow rate be in order to achieve breakthrough in the same breakthrough time as with a k of 0? The advantage of this scenario is that faster flow rates can treat more water per day and possibly allow fewer columns to operate. Reaction rates could be achieved, for example, by injecting a chemical reactant to degrade the contaminant adsorbed on the surfaces of the media. This might be achieved by injecting chlorine, hydrogen peroxide, or another oxidant, into GAC columns adsorbing hazardous organic contaminants.
Design 1: Design the length of a column needed to treat a hazardous organic contaminant. The influent concentration is 5 mg/L. The flow rate is set at 0.2 cubic meters per minute. Column diameter is 0.4 meters. Experiments reveal that the Kd value is about 1,000 L/kg and the dispersivity Dx is about 2 square meters per min. The media properties are porosity of 0.35 and bulk density of 5.5 kg/L. There is no reaction term. Breakthrough of 10% of initial concentration must be achieved no earlier than 7 days.
This learning module was supported by resources from the National Science Foundation.