![]() Introduction to Percolation Theory?
Introduction to Percolation Theory?
Simulation Animation
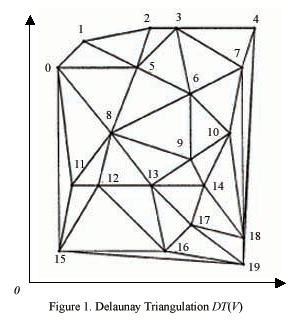
The network graph (Delaunay triangulation DT(V) ) is shown below. The nodes, representing cells, have been numbered from 0 to 19. A coordinate system is used so that distance and orientation of edges is defined. To simulate the spread of fire, we consider a simple model of fire spread depending on the topology of cells and the dynamic attributes at the time of fire, such as wind speed and wind direction. In particular, the probability of fire propagation from node i to a neighboring node j, pij, is decreasing with the length of edge (i,j), and increasing with the projection of the wind velocity (as a vector) on the directed edge (i,j). We started experimenting with exponential functions and as the animation shows they yield promising results.
Parameter definitions:
Start Node - The ignition node,
from which fire spreads through the finite percolation network; Wind
Speed - The speed of the wind at the time of the fire;
Wind Angle - The direction of
the wind with respect to the x-axis.
A Java applet has been developed to simulate the spread of fire. The user chooses from sets of possible values for the above three parameters. The fire is shown in red moving along edges from a node (cell) to neighboring node (cell). The fire stops its propagation usually when it reaches the boundary of the graph.
------Enter the applet here with
name "Animation Applet"------
Then, delete the powerpoint animation
but leave the "Simulation Results Graphic Representation".
In the following animation PowerPoint animations of two simulation results can be downloaded from the links below.
![]() Scenario 1. (PowerPoint animation)
Scenario 1. (PowerPoint animation)
StartNode = 8
WindSpeed = 20 km/h
WindAngle = 270o
![]() Scenario 2. (PowerPoint animation)
Scenario 2. (PowerPoint animation)
StartNode = 8
WindSpeed = 10 km/h
WindAngle = 90o
The Event Log files of the two scenarios.
![]() Scenario 1. (Event Log TXT file)
Scenario 1. (Event Log TXT file)
![]() Scenario 1. (Event Log TXT file)
Scenario 1. (Event Log TXT file)
Simulation Results Graphic Representation
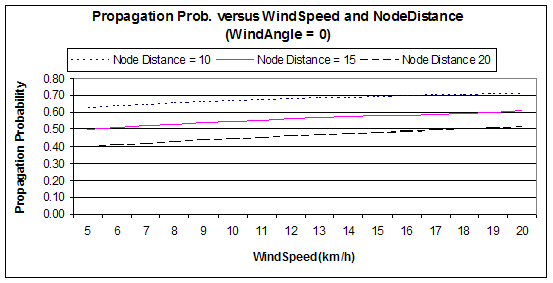
1. Propagation Prob. versus WindSpeed and NodeDistance (WindAngle = 0)

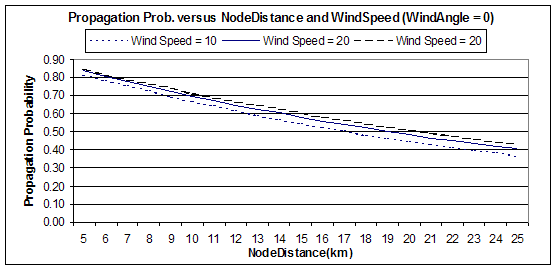
2. Propagation Prob. versus NodeDistance and WindSpeed (WindAngle = 0)

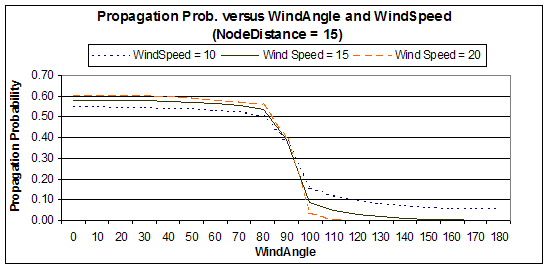
3. Propagation Prob. versus WindAngle and WindSpeed (NodeDistance = 15)
